Sales report
The sales report is your performance dashboard for one store: how much you sold, where orders came from, your best sellers and buyers, and an order-by-order list you can export.
Where to find it: open Insights → Reports, then tap the Sales summary card. Or go to
/reports/sales.
Plan
This is a paid feature. Check that your current plan includes it before you rely on it. Open Plans and subscription to compare plans and upgrade.
Before you start
- You need orders in the date range you pick, or the panels read "Not available".
- The report covers the store you're in. Switch stores from the store name at the top for a different one.
Steps
- Open the report and set the date window at the top. Tap a preset chip: Today, Last 7 days, Last 30 days, or Last 90 days. This window drives every panel on the page.
- For any other window, set the From and To dates by hand. The chips switch to a custom range.
- Read the KPI cards across the top for the headline numbers.
- Look at Orders per period for the sales trend, and By channel for where orders came from.
- Check By service type (dine-in, pickup, delivery), then Top products and Top buyers for your best sellers and most loyal customers.
- Scan Top orders for your biggest tickets in the range.
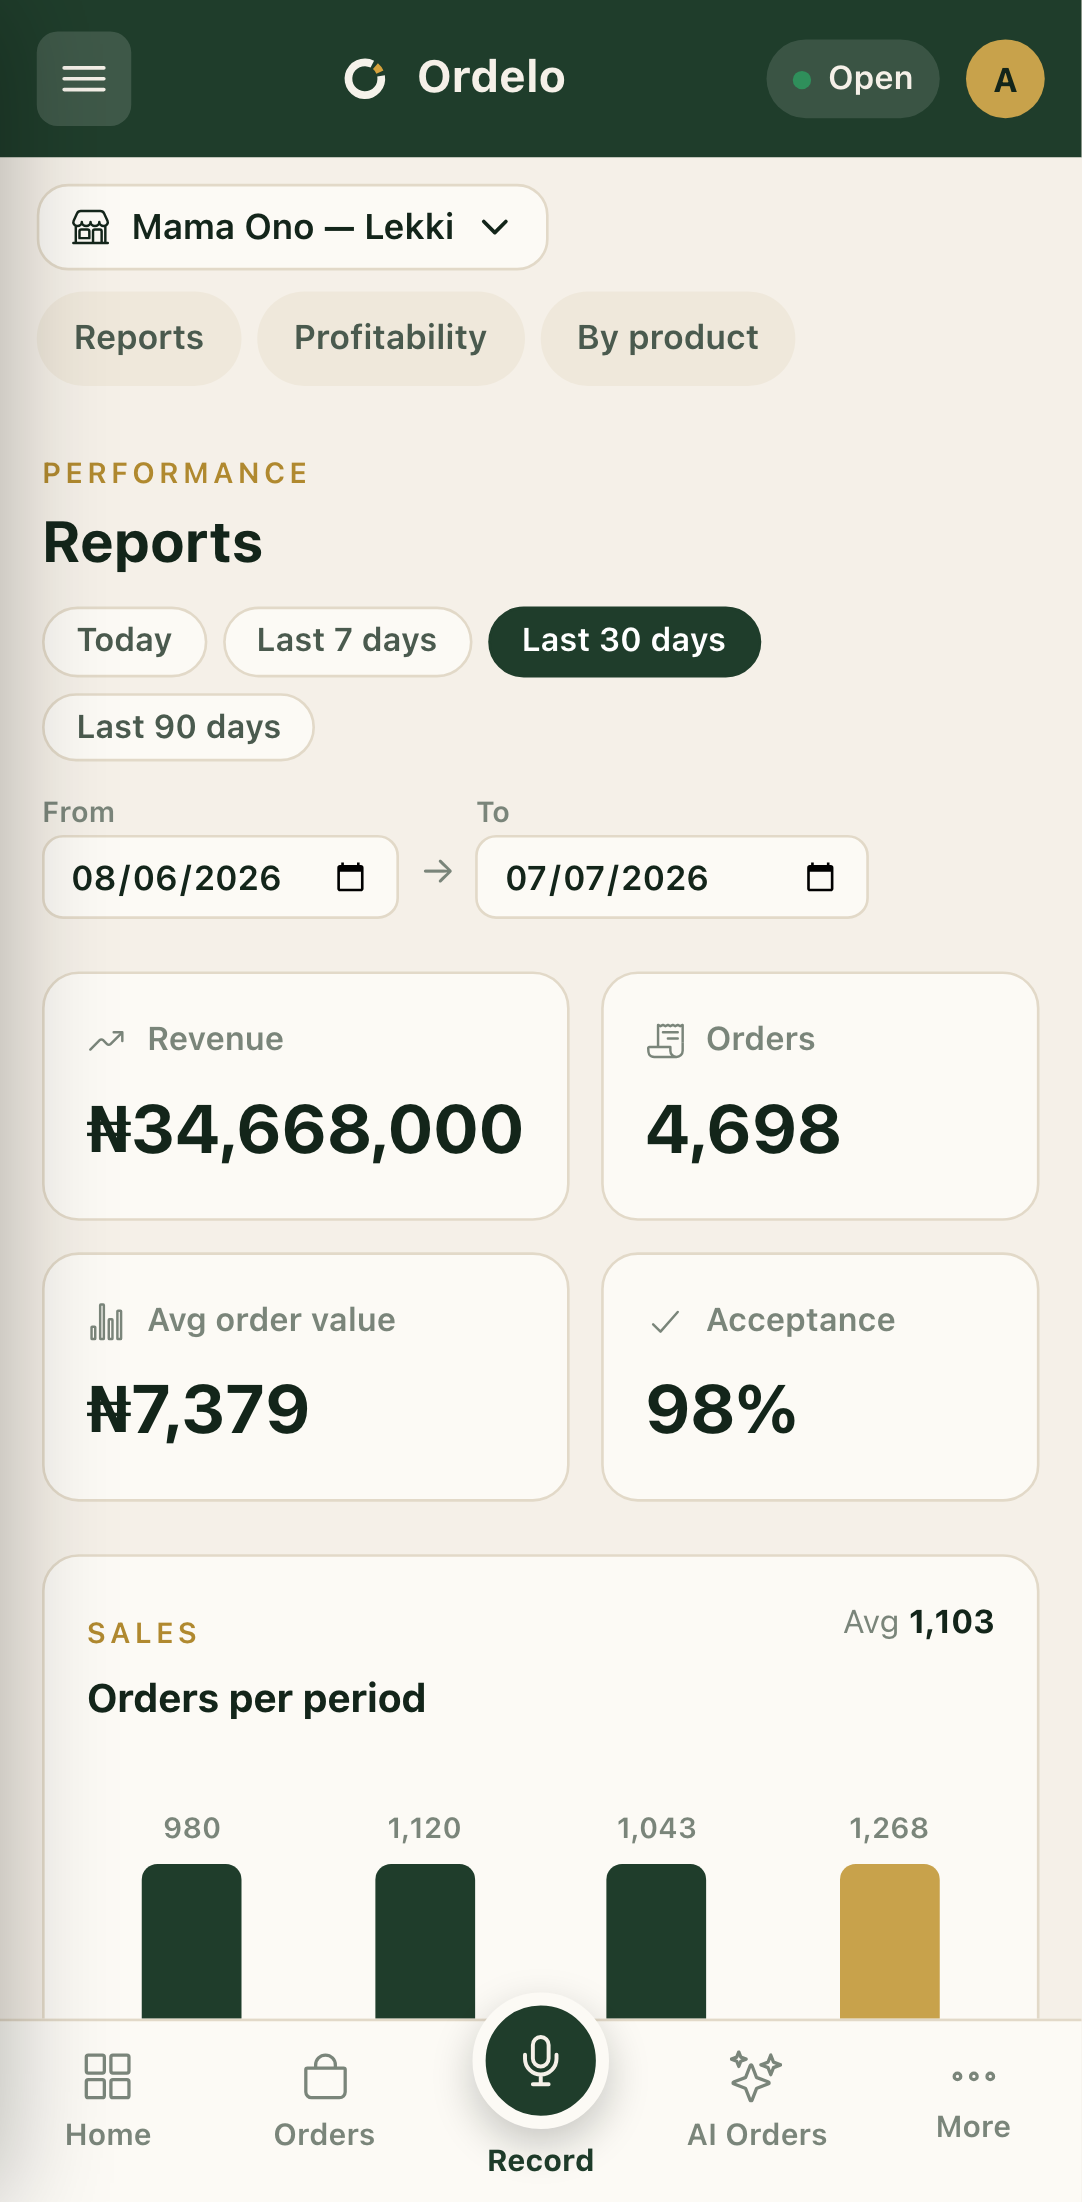 Sales report
Export the transactions
- Scroll to the Transactions panel at the bottom. It lists every order in the date range.
- Narrow it with the filter chips: by Service type and by Order status.
- Read the summary line above the table for the count of orders and total revenue after filtering.
- Tap Export to download a CSV. It includes the order number, date, customer, service type, channel, status, items, and total for each order in the current filter.
Tips
- The date window is everything. All the panels and the transactions list obey the same From/To range. If a panel is empty, widen the range first.
- Filter before you export. The Export button downloads exactly what's showing, so set the service-type and status filters the way you want them first.
- Total means your revenue. The money column is what the store earns on each order, not the full amount the customer paid. See Order pricing.
- Sales summary card = this report. Opening the Sales summary card in the reports hub brings you straight here.