Profitability
Sales tell you what you took in. Profitability tells you what you actually keep after cost. This report shows your margin overall and product by product, so you can see which items make money and which quietly lose it.
Where to find it: open Insights → Profitability, or go to
/profitability. For the per-product view, open Insights → By product, or go to/profitability/products.
Plan
This is a paid feature. Check that your current plan includes it before you rely on it. Open Plans and subscription to compare plans and upgrade.
Before you start
- Your product costs need to be set for margins to be right. Profit is worked out from selling price minus cost, so a missing cost throws the numbers off. See Build your menu and Recipes and costing.
- You need sales history in the period you pick, or the panels read "Not available".
- The report covers the store you're in. Switch stores from the store name at the top for another one.
The overview (/profitability)
- Open Insights → Profitability. Pick a period at the top: 30d, 90d, 6m, or 1y. Each stat shows its change against the previous period.
- Read the KPI cards: Revenue, Gross margin, COGS (cost of goods sold), and Net profit.
- Look at Sales over the period for the revenue trend, with the margin percentage for each period below it.
- Check Stock turnover to see how fast stock sells, next to an industry average.
- Scan Top performers (your best margins) and Lowest margins (the items that need attention).
- Read Inventory waste impact at the bottom. It breaks your losses into Expired, Damaged, Obsolete, and Returns.
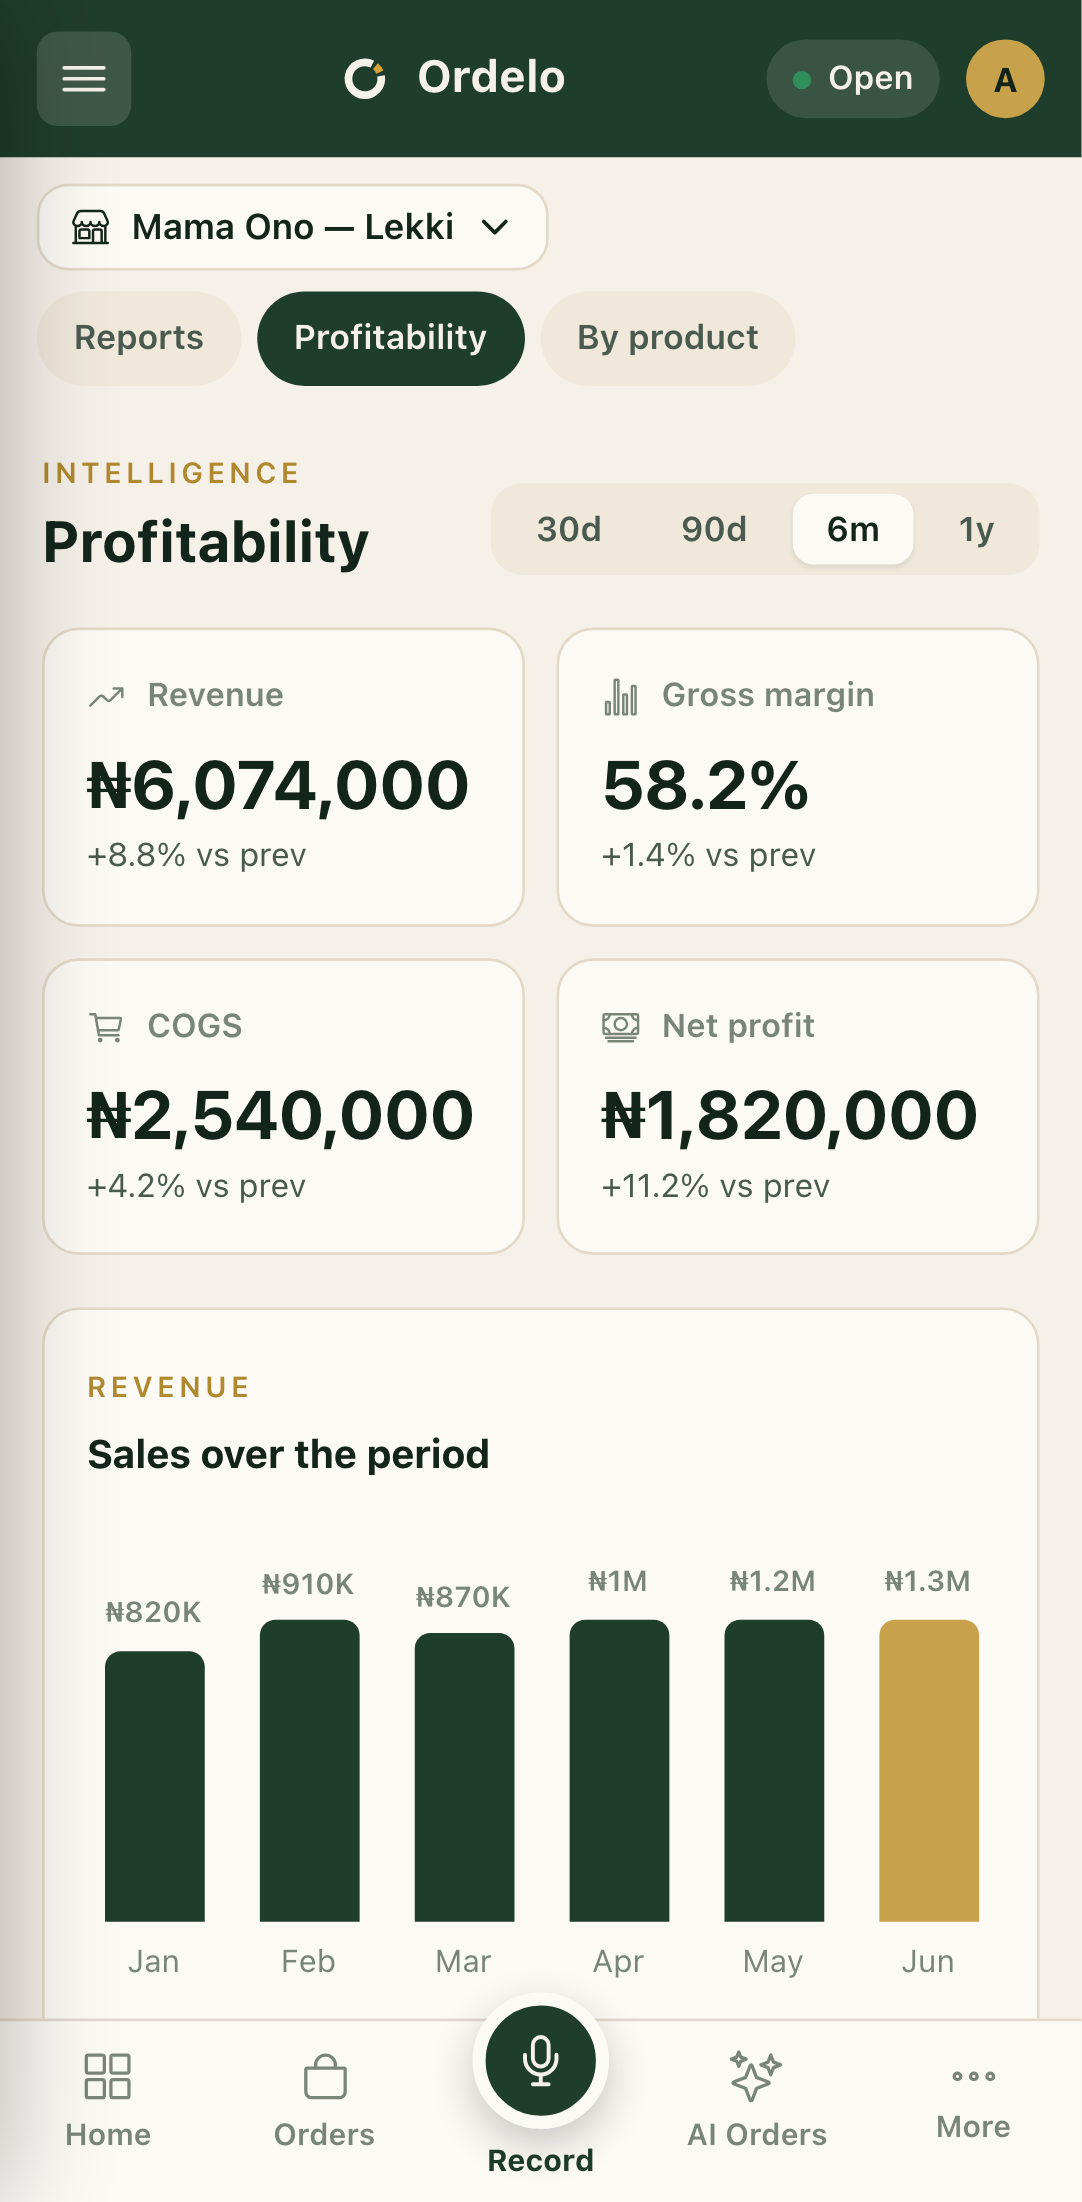 Profitability overview
Product by product (/profitability/products)
- Open Insights → By product. Pick a period at the top, same as the overview.
- Read the stat strip: Avg margin, Avg cost, Avg price, Units sold, Contribution, and Menu efficiency.
- Use By category to see which parts of the menu bring in the revenue.
- Sort the product list with the sort chips: Margin, Contribution, Units, Price, or Name. Tap the same chip again to flip the direction.
- Type in Search products… to jump to one item.
- Read each row: the product's category, units sold, cost, and price, with its margin and contribution on the right. A recipe tag means the cost comes from its recipe.
- Tap Export to download the product list as a CSV.
Tips
- Set your costs first. Margin is only as honest as the cost behind it. If an item shows an unbelievable margin, its cost is probably missing or wrong.
- Contribution beats margin for deciding what to push. A high-margin item that barely sells contributes little. Sort by Contribution to see what actually moves the needle.
- Watch the "Lowest margins" list. These are the items eating into profit. It's the fastest place to find a price to raise or a cost to cut.
- The period drives everything. Change 30d / 90d / 6m / 1y and every panel updates to that window.