Inventory insights
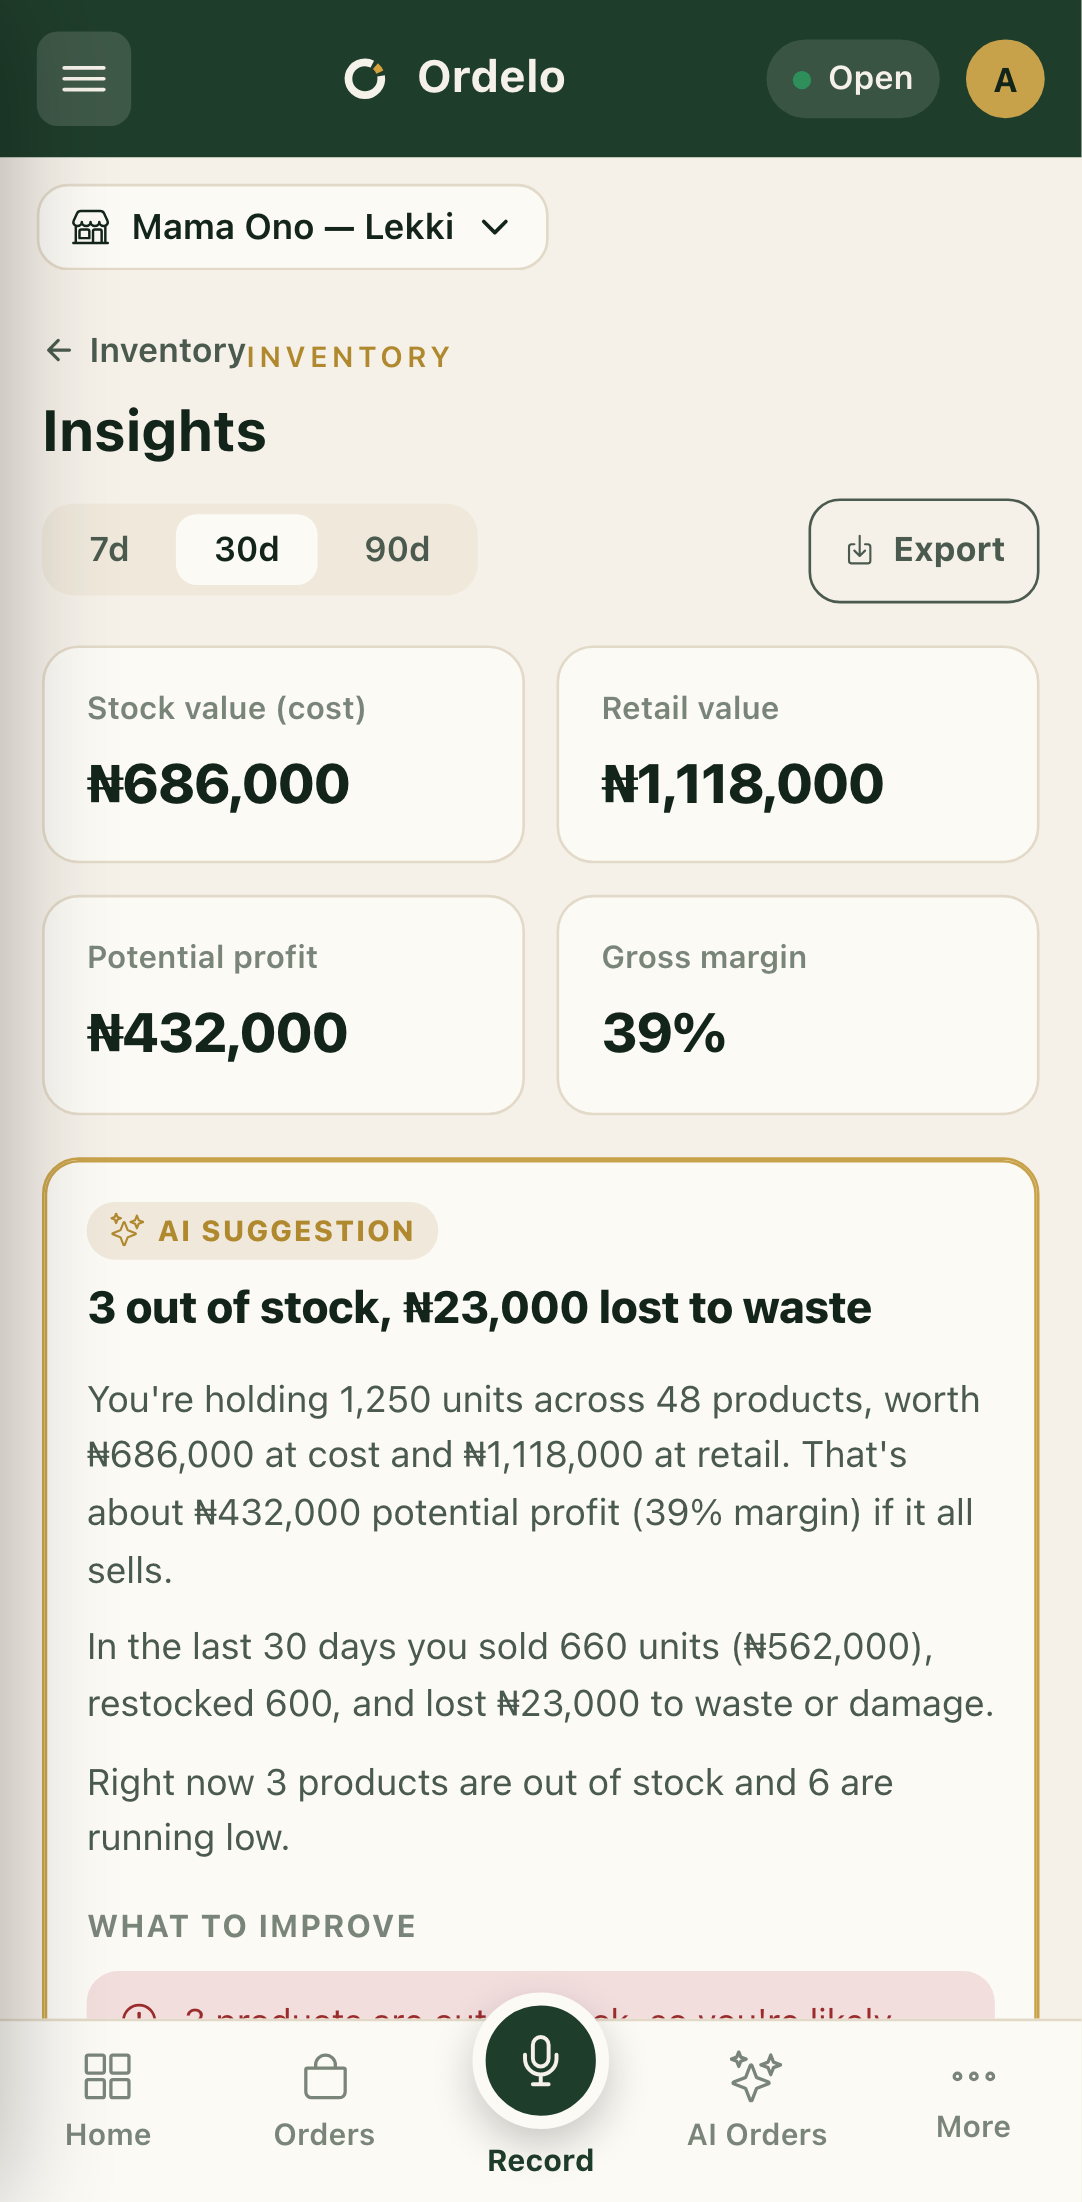
Insights turns your stock into a money view. It shows how much cash is tied up on your shelves, what sold and what got wasted over a period, your margins by category, and a short AI read of what to fix.
Where to find it: from Nav → Inventory, tap Insights in the top corner, or go to
/inventory/insights.
Plan
This is a paid feature. Check that your current plan includes it before you rely on it. Open Plans and subscription to compare plans and upgrade.
Before you start
- Track your stock first. Insights is built from your live inventory, so the numbers are only as good as your counts. See Track stock.
- Set a buying price on your products where you can. Cost value, potential profit, and margins all lean on it. Without it, the value and profit figures will read low.
Steps
- Open Nav → Inventory, then tap Insights.
- Pick a window with the period toggle at the top: 7d, 30d, or 90d. Everything on the page follows the window you choose.
- Read the four cards at the top: Stock value (cost) is the cash tied up, Retail value is what it's worth at your prices, Potential profit is the gap between them, and Gross margin is that gap as a percentage.
- Read the AI suggestion card. It gives a headline, a short summary, and a What to improve list. Items are colour-coded by priority.
- Check the Last N days row for what moved: Sold, Restocked, Waste / damage, and Returns, each with units and value.
- Look at Stock health for a quick count of items in stock, low, and out. Tap View stock → to jump to the list and act on them.
- Scroll to By category to see value and margin per category. A thin margin is flagged so it stands out.
- Tap Export to download the by-category breakdown as a spreadsheet.
 Inventory insights
Tips
- The AI note is a guide, not gospel. It's built from your stock and the period's movements, and the page says as much. Treat it as a prompt to look closer, not financial advice.
- Everything moves with the period toggle. If the flow numbers look small, check whether you're on 7d before reading them as a slow month.
- Waste is shown in red for a reason. It's the clearest place your money leaks. If that number climbs, dig into what's expiring or breaking.
- Missing buying prices drag your margins down. If a category shows a suspiciously thin margin, check that its products have a cost set.
- Export gives you the category breakdown, not the full item list. For every item and its stock value, use Export on the Track stock page instead.